W Residences Sentosa Cove Price History: From S$2,736 psf to S$1,830 psf
Last updated: September 2026 · By Kaeden Ong, Assistant Division Director, ERA Realty Network
See the full The Residences at W Singapore – Sentosa Cove project page — availability elevation chart, unit mix, floor plans, videos and the latest transacted prices, refreshed daily.
Search "W Residences price" and you'll find two sets of numbers that look like they belong to different buildings: one around S$2,700–2,900 psf, the other around S$1,650–1,950 psf. Both are correct. They're sixteen years apart, and what happened in between is the most useful case study in Sentosa Cove for anyone working out what a unit here is worth.
This article covers the full price history of The Residences at W Singapore – Sentosa Cove: the 2010 launch, the unsold decade, the April 2024 relaunch, the 2025–26 caveats, current asking, what drives price within the project, and how to judge fair value.
2010: the launch at S$2,736 psf
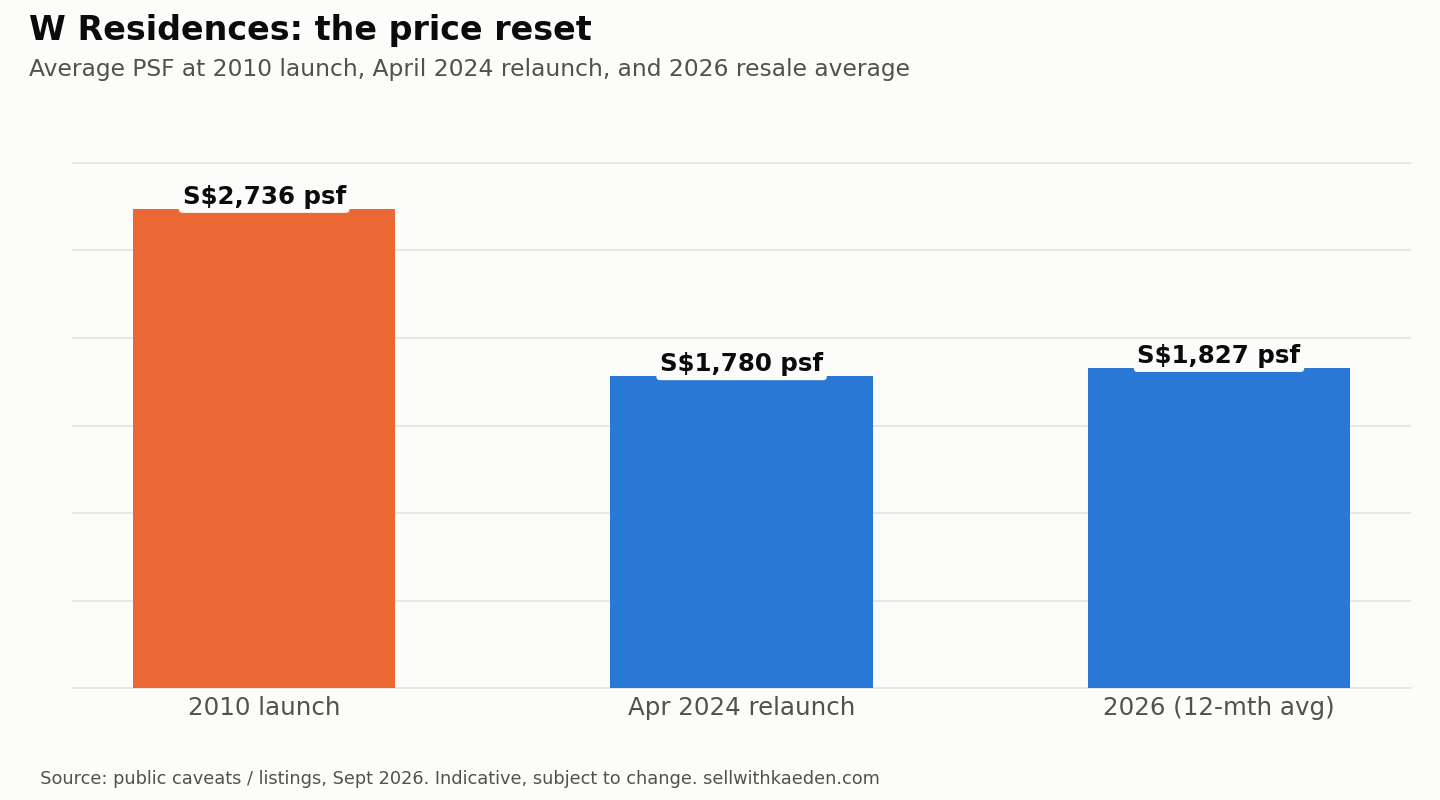
W Residences launched in 2010 at an average of roughly S$2,736 psf. The high-water mark came in April 2010, when a 1,259 sq ft unit went for S$2,968 psf, top-of-Cove pricing at the time.
The pitch was strong: 228 units in seven six-storey blocks on about 250,000 sq ft, a W hotel next door, mooring berths, Quayside Isle beside it. The building delivered; TOP came on 31 March 2011. The buyer volume the price assumed did not.
2011–2023: the unsold decade
Most units did not sell at launch pricing. Instead of cutting, CDL moved the unsold residential component into a private investment platform (Profit Participation Securities); even in December 2025 CDL described the "unsold residential component" as "held as part of a private investment platform".
Two consequences for anyone reading the price history:
- The resale market was tiny. With 203 units still developer-held going into 2024, the handful of resale caveats say little about what the building was worth at volume.
- The 2010 number never got tested. A price that isn't transacting is an asking price, not a market price.
Meanwhile the wider Cove moved: 99-year condos averaged S$1,498 psf in 2020, S$1,970 psf in 2023 and S$1,899 psf in 2024 (down 3.6%). The Oceanfront @ Sentosa Cove, completed in the same 2010 window, trades around S$1,724 psf. W Residences at S$2,700+ sat a long way above its own market.

April 2024: the relaunch, 40% lower
On 15 April 2024 (with viewings from 10–14 April), the developer released 58 of the 203 developer-held units at roughly 40% below 2010 pricing:
| Type | Size | From | PSF |
|---|---|---|---|
| 2-bedroom | 1,227 sq ft | S$2.118m | S$1,726 |
| 3-bedroom | 1,625 sq ft | S$2.678m | S$1,648 |
| 4-bedroom | 2,067 sq ft | S$3.488m | S$1,687 |
65 units sold in the first week at an average of about S$1,780 psf, more than the 58 originally released. Buyers were 94% Singaporean or PR and 6% foreign (China, France, US), and roughly half came from outside District 4: the pricing pulled in mainland upgraders. The developer indicated future phases would come at slightly higher psf.
The lowest recorded resale psf, S$1,645 for a 1,625 sq ft unit, also dates from April 2024 and is the floor of the modern price history. Seventeen penthouses were still unsold in the 2024 marketing, so the developer remains the price-setter for the largest units.
2025–2026: where the caveats have settled
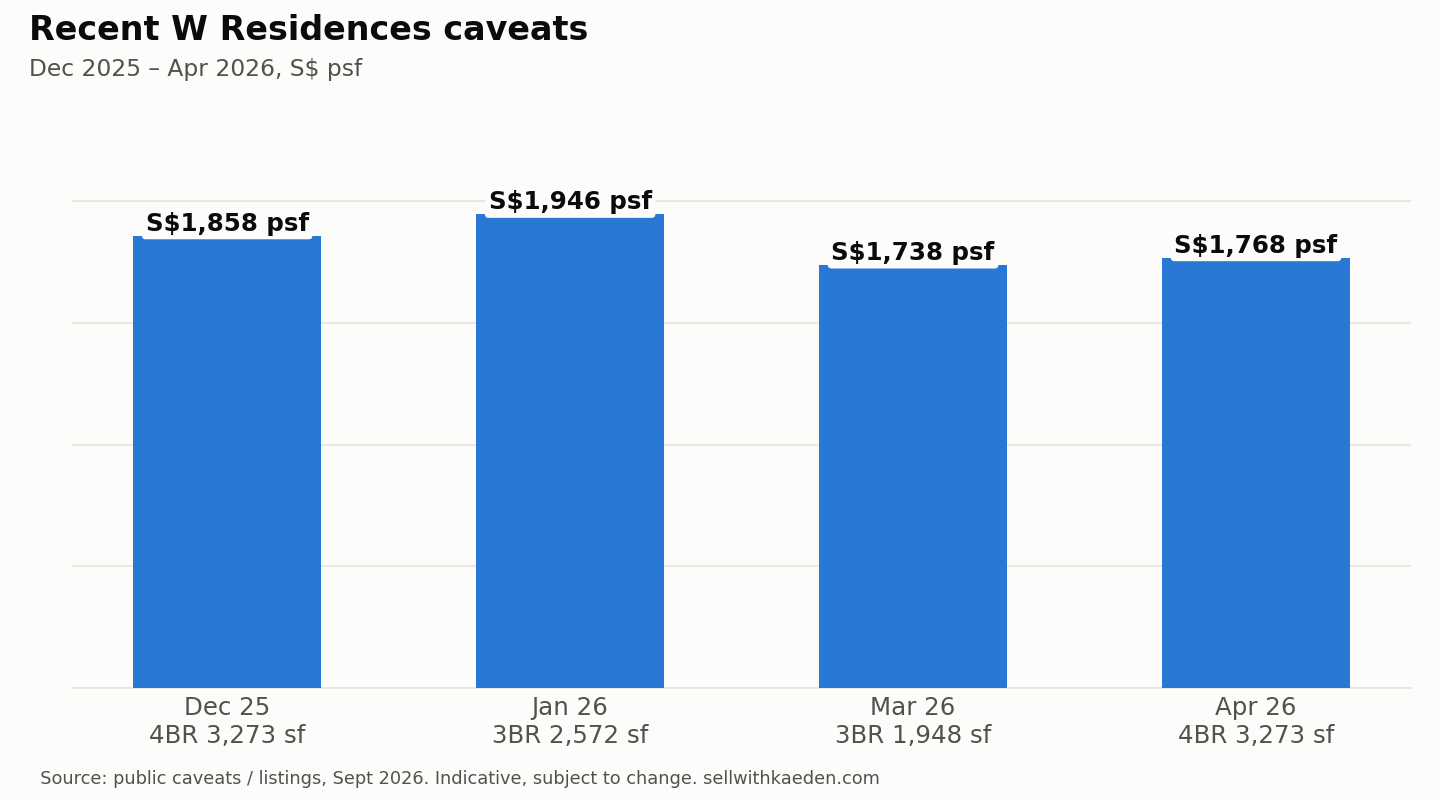
Recent transactions (approximate, from public caveat records):
| Date | Type | Size | Price | PSF |
|---|---|---|---|---|
| Dec 2025 | 4BR | 3,273 sq ft | S$6.08m | S$1,858 |
| Jan 2026 | 3BR | 2,572 sq ft | S$5.01m | S$1,946 |
| Mar 2026 | 3BR | 1,948 sq ft | S$3.39m | S$1,738 |
| Apr 2026 | 4BR | 3,273 sq ft | S$5.79m | S$1,768 |
Reading these together:
- Average psf is about S$1,830 (6-month S$1,838; 12-month S$1,827), range roughly S$1,738–1,985. That is about 3% above the relaunch-week average of S$1,780, consistent with the developer's "slightly higher later" guidance.
- The 12-month average transaction price is about S$3.28m: the typical deal is a 3-bedroom, not a penthouse.
- Same footprint, different price. The two 3,273 sq ft 4-bedders sold at S$1,858 psf in December 2025 and S$1,768 psf in April 2026, about S$290,000 apart. I read that as stack and floor plus low-volume noise, not a trend down.
- 2010 buyers who held are still underwater. Bought at S$2,736 psf, sold at S$1,830 psf is a loss of roughly a third before stamp duty and holding costs. Anyone who says Sentosa Cove "always comes back" should be shown this building.
Current asking prices (September 2026)
- 3-bedroom entry: about S$2.8–2.9m
- Developer 3-bedroom listings: about S$2.9–4.45m
- Developer 4-bedroom listings: about S$3.56–4.52m
- Penthouses: about S$4.07–10.86m
Asking sits a step above the S$1,830 transaction average, which is normal. What matters is that the developer is still listing across all three size bands, so any resale owner has to price against a developer that has already shown it will move stock at the right number.
What drives price within W Residences
In a seven-block, six-storey estate the spread is narrower than in a tower, but it is there:
- Frontage. Marina- and berth-facing units carry the premium; internal-grounds or Ocean Way-facing units don't.
- Floor. Sixth-floor units and penthouses get the views; ground-floor units trade on garden or pool access.
- Type and efficiency. 3-bedrooms run from about 1,625 to 2,616 sq ft, and larger layouts don't always fetch the same psf as compact ones. The January 2026 2,572 sq ft unit at S$1,946 psf shows a good big unit can still lead the building.
- Developer versus resale. Developer units bring first-hand condition and price discipline; resale can be sharper when an owner needs to move.
- Condition. A 2011 building; some units have been tenanted for a decade.
Floor-plan detail by type is in the floor plans and unit types guide.
How to judge fair value in 2026
The framework I use with buyers, in order:
- Ignore 2010. No lender or valuer will treat it as a reference price.
- Start from the 12-month average of about S$1,827 psf. Adjust up for marina frontage and high floor, down for internal-facing or ground floor.
- Cross-check the neighbours. Cape Royale at about S$2,250 psf is the newer, taller, bigger-unit benchmark; The Oceanfront at about S$1,724 psf is the same-vintage benchmark. W Residences between them at S$1,830 psf, with hotel services, is defensible. Above S$2,000 psf is harder to defend while the developer still holds stock.
- Compare on quantum and yield, not just psf. A 3-bedder at S$3.3–3.4m renting at about S$11,200 gives roughly 3.5–3.6% gross, versus 3.1–3.2% at Cape Royale.
- Look at the mainland alternative. A CCR new launch in 2026 is typically S$3,000+ psf. You give up the MRT and get roughly 60% more space for the money.
I run this working for each stack in the W Residences investment analysis.
The lesson on developer-held stock
W Residences is the clearest example in Singapore of what happens when a developer holds unsold stock rather than mark it down. For thirteen years the headline price stayed high, the resale market stayed thin, and 2010 owners had no realistic exit near their entry. When the reset came, it came all at once and went 40% deep.
For buyers today the lesson cuts two ways. The reset has happened; you are buying at a price that cleared 65 units in a week from mostly local buyers, about as tested as a Sentosa Cove price gets. But the developer still owns a large part of the building, wants slightly higher psf over time, and will remain the marginal seller for years. That is a ceiling on short-term upside as much as a floor under the price.
Cape Royale went through a milder version, held as a rental portfolio until 2022 and then sold at a price the market accepted, but it never had a 2010 launch price to fall from. That history is in the Cape Royale buyer's guide.
Frequently asked questions
What was the launch price of W Residences Sentosa Cove? The 2010 launch averaged about S$2,736 psf, with a peak of S$2,968 psf in April 2010 for a 1,259 sq ft unit.
How much did W Residences prices drop at the 2024 relaunch? The April 2024 relaunch priced 58 units about 40% below 2010 levels: 2-bedrooms from S$1,726 psf, 3-bedrooms from S$1,648 psf and 4-bedrooms from S$1,687 psf. 65 units sold in the first week at an average of about S$1,780 psf.
What is the current W Residences price per square foot? The average is about S$1,830 psf (12-month S$1,827; 6-month S$1,838), with recent caveats between roughly S$1,738 and S$1,985 psf.
What is the cheapest unit at W Residences? Current asking for a 3-bedroom starts at about S$2.8–2.9m. The lowest recorded resale psf is S$1,645, from April 2024.
Why were most W Residences units unsold for so long? The 2010 pricing was above what the market would pay at volume, and the developer chose to hold the unsold units in a CDL private investment platform rather than cut prices until the April 2024 relaunch.
Is W Residences cheaper than Cape Royale? Yes on psf. W Residences averages about S$1,830 psf against about S$2,250 psf at Cape Royale, though Cape Royale is a newer building with larger units.
Ready to look at W Residences?
I keep a live comparison of all 10 Sentosa Cove non-landed projects (PSF, yield, liquidity), updated as caveats land. If you want to see where a specific W Residences stack sits against the building average and Cape Royale, message me and I'll send the sheet before we arrange a viewing.
Kaeden Ong · Assistant Division Director, ERA Realty Network · ERA Top 50 · CEA Reg. L3002382K sellwithkaeden.com · WhatsApp for a same-day reply
Disclaimer: This article is for general information only and is not investment, financial or legal advice. Figures, prices, charts and regulations are drawn from public sources and my own records as of September 2026; they may contain errors, are subject to change without notice, and should be independently verified against URA caveats, IRAS, MAS and the relevant developer or MCST before any decision. Past prices are not a guide to future prices. Please speak to a licensed property agent, banker and lawyer about your own situation.
Any prices or charts shown are subject to change and may not be accurate. For reference only, subject to change, not investment advice.
Disclaimer: Project information, pricing, promotions, availability, transaction figures, calculations and charts are provided for general information and research purposes. They are indicative, may not reflect real-time status, may change without notice and should be independently verified and confirmed before making a purchase decision. Historical transactions are for reference only and are not a valuation. Calculations are estimates only. Nothing on this website constitutes financial, legal or investment advice.
← All insights